
Charts Module
An implementation of selected charts from the amCharts 4 library
The module has two charts for use: The Sankey diagram and the Chord diagram. If you have any comments please email module.support@bijc.co.uk.
Chart Module Changelog
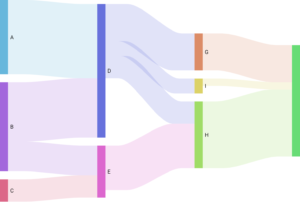
Sankey Diagram
A Sankey diagram is a flow diagram used to depict branched, multi-level flows of values. The sizes of the links are proportional to the value of the link.
Each data point can describe a single node or a full link and there is a number of propery fields that can be used to override the default settings in the template properties.
Component Property Documentation
Data Property Fields Documentation
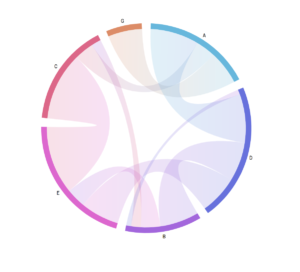
Chord Diagram
A Chord diagram is used to indicate one-level quantitative relations between multiple items, organized in a circular diagram.
Each data point can describe a single node or a full link and there is a number of propery fields that can be used to override the default settings in the template properties.
Component Property Documentation
Data Property Fields Documentation
To download a trial of the Charts module please enter your email below – a link to download will be provided. We will not contact you unless you ask for support or you ask for a license. If you would like to purchase a licence for $500 please contact us at module.support@bijc.co.uk